劍橋雅思13Test2寫作Task1題目+范文及解析
2018/6/22 11:24:00來源:新航道作者:新航道
摘要:很多雅思考生一直想要劍橋雅思13寫作資料,但是卻總是找不到,現在烤鴨們不用擔心了,上海新航道雅思小編為大家馬上帶來關于劍橋雅思13Test2雅思寫作Task1范文及解析,供大家參考。
很多雅思考生一直想要劍橋雅思13寫作資料,但是卻總是找不到,現在烤鴨們不用擔心了,上海新航道雅思小編為大家馬上帶來關于劍橋雅思13Test2雅思寫作Task1范文及解析,供大家參考。
劍橋雅思13Test2寫作Task1題目+范文及解析
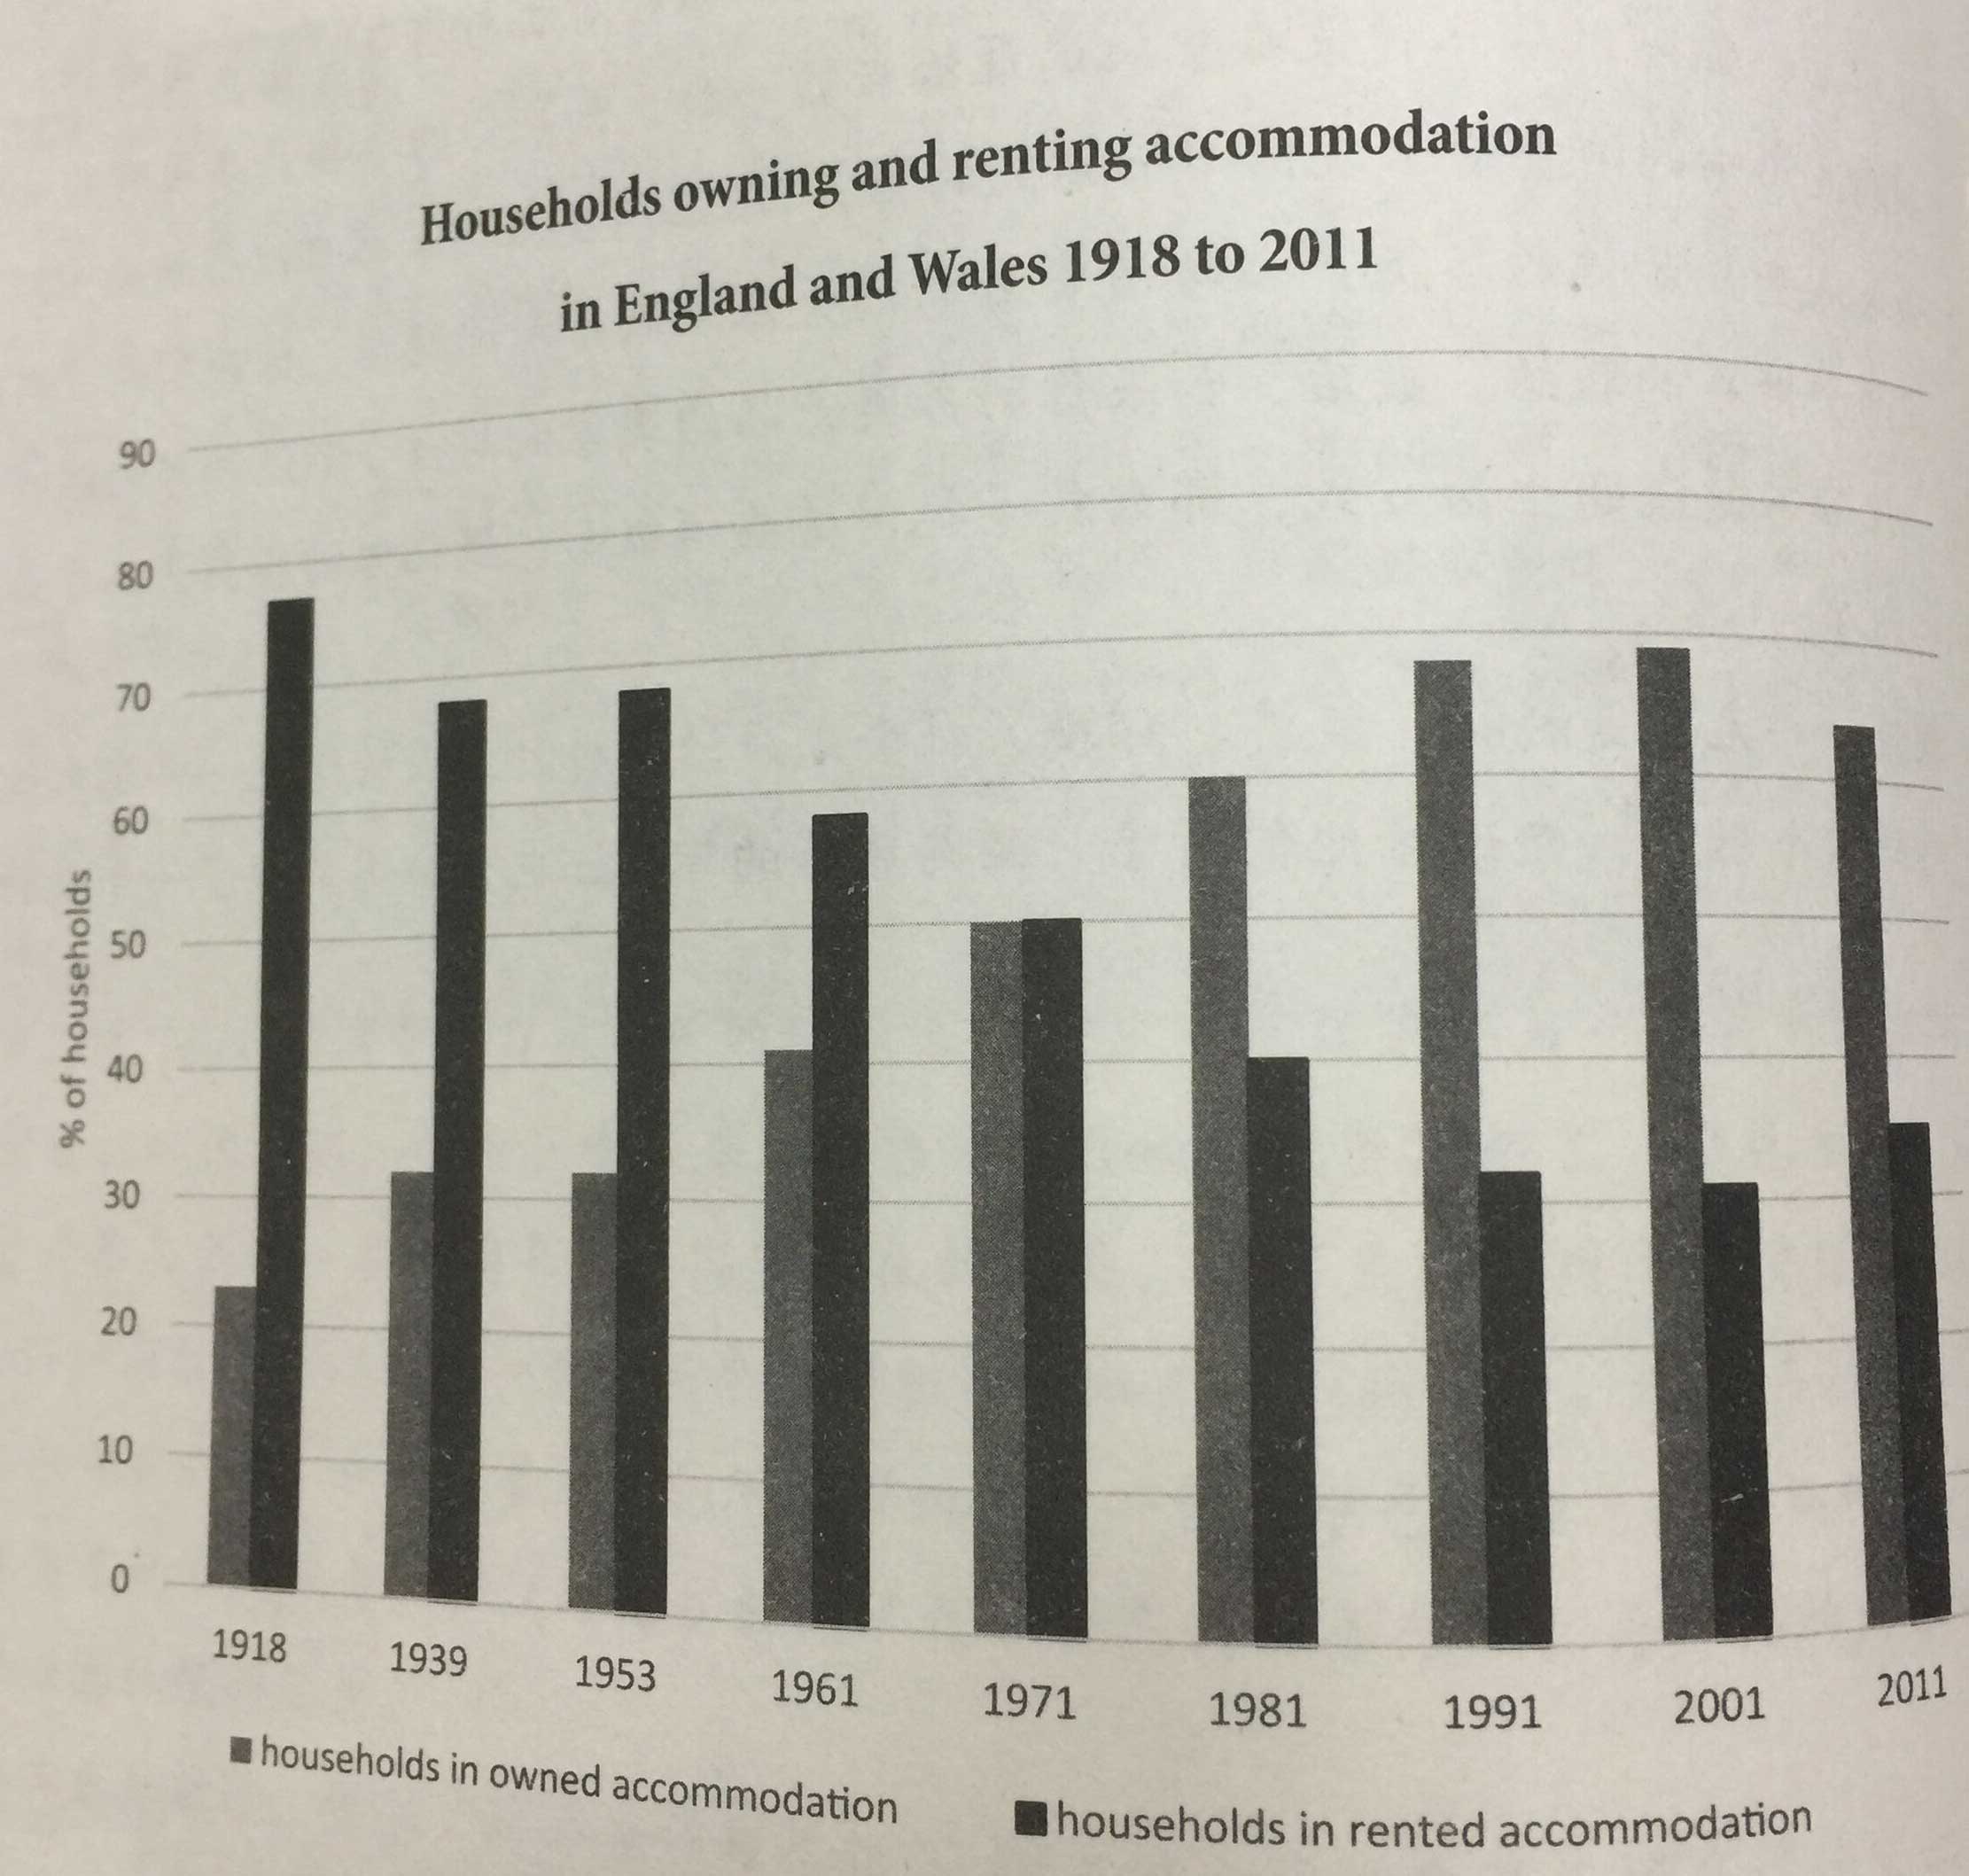
The chart below shows the percentage of households in owned and rented accommodation in England and Wales between 1918 and 2011.
Summarise the information by selecting and reporting the main features, and make comparison where relevant.
題目分析
要點
1.本圖的趨勢比較明顯:一個呈漸增的趨勢,一個呈漸降的趨勢,除了最后一年;
2.每兩類數據相加之和應為100%,提及具體數據時應注意這一點。
錯誤理解
1.不要對這種數據變化的趨勢進行主觀的猜測。
雅思參考范文:
This bar chart illustrates the quantity of people that either owned or rented their accommodation over a period of about a century, 1918-2011
Firstly, looking at the owned accommodation, we can clearly see that in 1918 there were only a little more than 20% of people. This grew steadily until 2001, where it peaked over more than triple what it started at; a little less than 70%. The final year of the chart shows this value at roughly 65%.
Moving on to the rented accommodation, these figures show a continual decline from 1918 to 2001, with approximately 77% and 31% respectively. Again, in 2001, the trend reversed and went up slightly to finish at 35% in 2011.
In summary, over the last hundred years or so it is shown that more people now own their houses whereas renting was the most popular choice at the beginning of the 20th century.
譯文:
這幅柱狀圖顯示了在將近100年間(1918年至2011年)擁有及租賃住房的家庭數量。首先來看自有住房,我們可以清晰地看到,在1918年,只有20%多的人。這一數量直持續增長至2001年,那時它達到頂峰,數量將近起始數量的三倍,接近70%。圖表最后一年的數據約為65%
再來看租賃住房,數據表明從1918年至2001年一直在持續下降,分別從約77%下降至約31%。同樣在2001年,這一趨勢開始逆轉,出現輕微上漲,至2011年最終達到35%。
總之,過去約100年的數據表明,現在更多的人擁有住房,而在20世紀之初的時候更多人的選擇租賃住房。
小編為大家帶來關于《劍橋雅思 13真題寫作》供大家閱讀參考,新航道雅思資料頻道將第一時間為考生發布最全、最新、最專業的雅思資訊及雅思考試資料及機經.
免費獲取資料
熱報課程
- 雅思課程
| 班級名稱 | 班號 | 開課時間 | 人數 | 學費 | 報名 |
|---|
免責聲明
1、如轉載本網原創文章,情表明出處
2、本網轉載媒體稿件旨在傳播更多有益信息,并不代表同意該觀點,本網不承擔稿件侵權行為的連帶責任;
3、如本網轉載稿、資料分享涉及版權等問題,請作者見稿后速與新航道聯系(電話:021-64380066),我們會第一時間刪除。
全真模擬測試


制作:每每
