2021年5月15日雅思寫作機經小作文范文及解析-四個美國工廠生產一輛車花費時間
2021/6/16 17:07:54來源:新航道作者:新航道
摘要:每場雅思考試之后,新航道上海學校雅思頻道小編會第一時間分享雅思考試小作文范文及解析,希望對各位備考考生們有所幫助,對雅思寫作有所提高!本文是5月15日雅思小作文范文及解析。
每場雅思考試之后,新航道上海學校雅思頻道小編會第一時間分享雅思考試小作文范文及解析,希望對各位備考考生們有所幫助,對雅思寫作有所提高!本文是5月15日雅思小作文范文及解析。
雅思小作文題目:
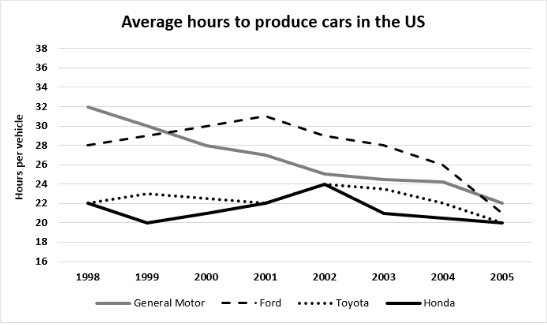
The graph below shows the average time spent by four car manufacturers to produce vehicles at their US factories from 1998 to 2005.
Summarise the information by selecting and reporting the main features, and make comparisons where relevant.
參考范文
The line graph compares the changes in the average hours needed to manufacture a vehicle by four companies – General Motor, Ford, Toyota and Honda – at their producing sites in the US between 1998 and 2005.
It is clear that GM had successfully improved their productivity, with the average time reducing from 32 hours per vehicle to 22 hours during the given period, although the figure remained the highest among the four producers. In Ford's factories, there was an initial increase in the figure from 28 hours to over 30 until 2001, after which the factories started to achieve higher efficiency. By 2005, the time needed to produce a car had descended to just 21 hours.
In terms of Toyota and Honda, both manufacturers kept their average production time at a low level between 20 and 24 hours per car, maintaining higher productivity than the other two competitors. Despite wild fluctuations throughout the whole period, factories of both Toyota and Honda managed to slightly reduce the average time.
Overall, while the two Japanese car companies produced vehicles more quickly in general, the two US manufacturers had narrowed the gap remarkably.
以上就是關于雅思寫作小作文的寫作范文,更多資訊,請關雅思頻道 。
免費獲取資料
熱報課程
- 雅思課程
| 班級名稱 | 班號 | 開課時間 | 人數 | 學費 | 報名 |
|---|
免責聲明
1、如轉載本網原創文章,情表明出處
2、本網轉載媒體稿件旨在傳播更多有益信息,并不代表同意該觀點,本網不承擔稿件侵權行為的連帶責任;
3、如本網轉載稿、資料分享涉及版權等問題,請作者見稿后速與新航道聯系(電話:021-64380066),我們會第一時間刪除。
全真模擬測試

雅思動態

雅思高級詞匯作文模板范文

制作:每每
